Join us in Austin, TX this summer for the ESIP July Meeting! Early Registration and Call for Session Proposals now open.
Applying remote sensing to land cover change analyses
I recently traveled to Brazil as part of a course on agroecology. The class itself was part of a larger, multi-decade project to implement agroecological practices on farms in a rural area of Santa Catarina state called Santa Rosa de Lima. Due to the hilly terrain, dairy farming in this region is common, and most farmers run relatively small operations with small profit margins.
In response to massive deforestation of native forests in Brazil, the Brazilian government has enacted a number of laws designed to protect the most valuable portions of the forest that remains. For example, land within 30 meters of small rivers and/or 50 meters of springs must remain forested. These policies can have a dramatic effect on farmers who own small amounts of land and are only barely making ends meet—precisely the sort of farmers that dominate Santa Rosa de Lima. As a result, the vast majority of farmers in the area do not comply with the forest code. Additionally, when non-forested land is not being used, farmers frequently plant eucalyptus and pine plantations in order to prevent native forest from re-growing, since they would not be allowed to clear native trees if they wanted to use the land again the future. As a result of these practices, water quality, biodiversity, carbon storage, and other ecosystem services suffer.
The agroecology project’s goal is to implement practices such as rotational grazing that can increase the productivity of dairy farms in Santa Rosa de Lima. If farmers can generate a higher profit from the same amount of land, they may be more amenable to taking some land out of production in order to comply with the forest code.
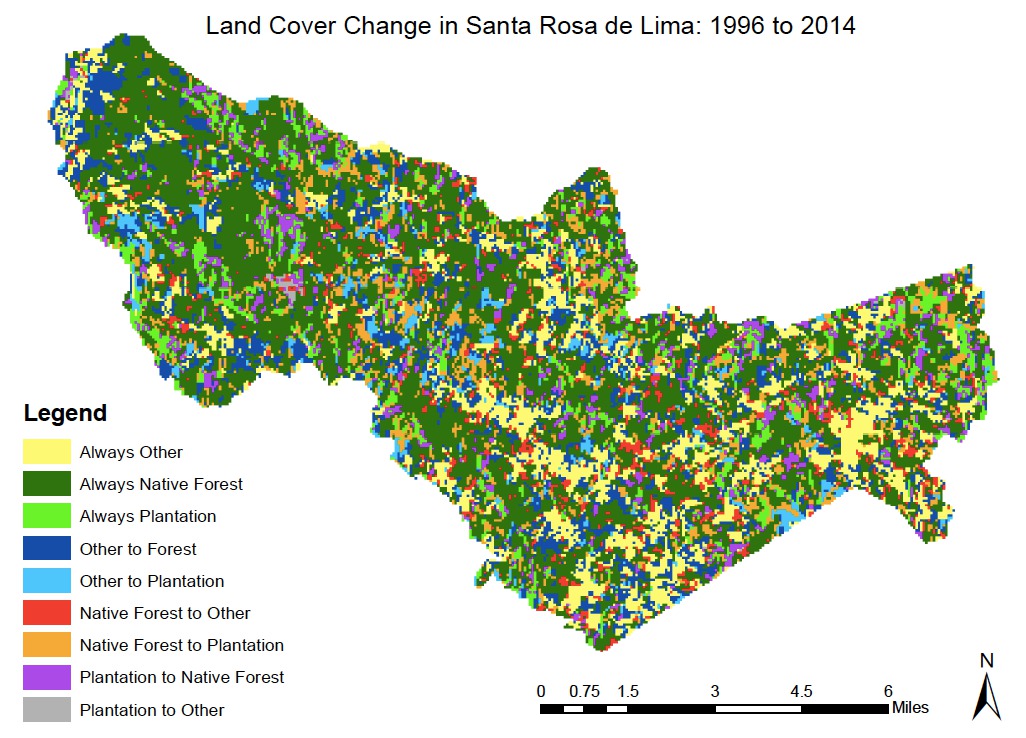
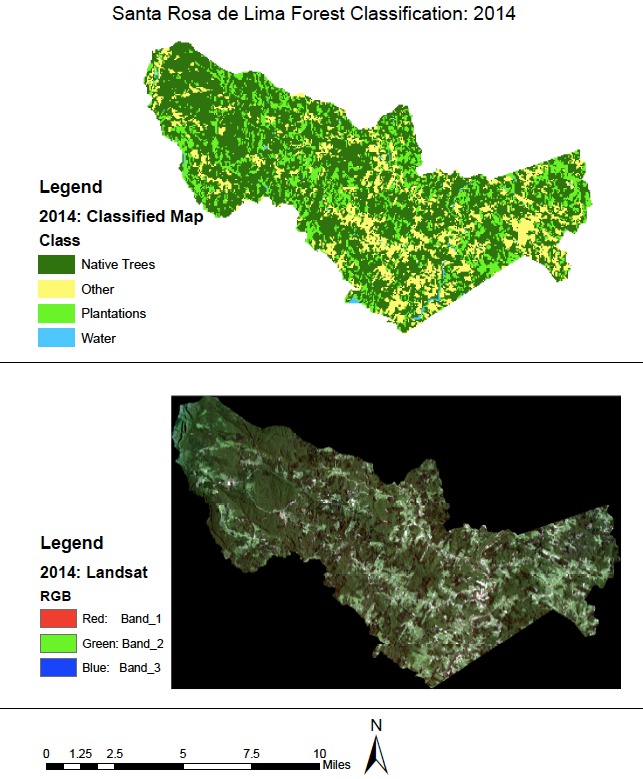
As part of this project I performed an analysis of how forest cover has changed in Santa Rosa de Lima over the course of the project. I used Landsat satellite data from 1996, 2005, and 2014 and found pixel brightness to be a good predictor of whether pixels were native forest, plantation forest, or non-forest. I used eCognition, an object-based image classification program, to perform the analysis. I used Google Earth imagery, which has much higher resolution that Landsat and thus allows for visual detection of native vs. plantation forest, to validate my results.
I found that both native and plantation forest area has increased from 1996 to 2014, and that native forest seems to have recovered from a dip in total area in the early 2000s. Google Earth data wasn’t fully available for my earliest time step, but my 2014 land cover map was 76.7% accurate overall. These results indicate that loss of native forest in Santa Rosa de Lima may not be a significant problem as it is elsewhere in the country, though the reasons for the observed increase in native forest must be further explored.
Freely-available remotely-sensed data products such as Landsat and Google Earth make it possible to perform these sorts of land cover change analyses in remote areas that otherwise lack comprehensive data on land use. However, my analysis was limited by the resolution and temporal scope of the data available. Higher-resolution imagery was available for my study area, but I had to retrieve it from a researcher in Brazil and it lacked standardized metadata, making it difficult to use. Standardizing metadata for remotely-sensed products and improving data discovery would make a significant impact in improving the feasibility and accuracy of these sorts of analyses in remote areas. The EnviroSensing cluster has recently done substantial work on sensor best practices—enabling researchers to use the data that is already available should continue to be a part of that discussion.