Innovation to Impact. See you at the July ESIP Meeting.
Guest Blog: Managing the Texas Water Observatory Database

In his guest blog, Debasish Mishra shares insights on data management through his experiences as a graduate student at Texas A&M and as an Earth Science Information Partners (ESIP) Community Fellow. Debasish has supported the Soil Ontology and Informatics Cluster this year and his interdisciplinary research brings together hydrology, soil science and data science.
An important aspect of being a PhD student that often goes unspoken is the need to take on additional responsibilities when the lab requires it. In my case, I was tasked with overseeing the database management for the Texas Water Observatory (TWO) as a side project.
Through this experience, I’ve realized that managing a database is a fundamentally different challenge compared to working with large-scale remote sensing datasets. While both center on data, each requires a distinct set of skills. Working with datasets focuses more on analysis, processing and interpretation of data, while managing a database demands attention to data organization, infrastructure, security and ensuring efficient access to the data.
Balancing these roles often requires stepping outside my comfort zone and acquiring skills that might not be directly applicable to my research but are invaluable in supporting the broader scientific community.
This became even more evident during my time at the 2024 July ESIP Meeting which exposed me to a completely new world of individuals who work in making data “research ready.” Many I have come to realize deserve more appreciation from mainstream academia. Hence, through this article I wish to reflect on some of my learnings and challenges in navigating my database management journey so far.
Data Management for the Texas Water Observatory (TWO)
In my graduate work, I help manage data for TWO, which is a network of field stations strategically placed across nine sites along the Brazos River corridor in Texas.
This initiative is akin to larger global consortia like Ameriflux, NEON and AsiaFlux, all of which monitor land-atmosphere exchanges of greenhouse gasses and energy to better understand ecosystems and climate dynamics.
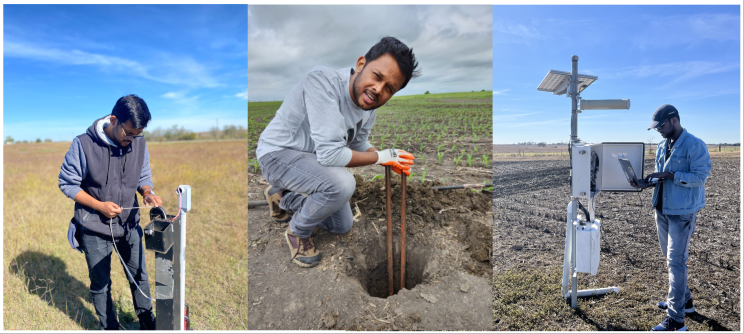
These diverse datasets are made possible by various field sensors installed at each location, including eddy covariance towers, soil moisture and matric potential sensors and sondes for groundwater monitoring. I have tagged along with colleagues Beomseok Chun and Rishabh Singh who currently oversee the field sites. The success of TWO is largely due to collaboration, including the team I work with now and past students.
That said, overseeing these field stations and managing the associated database comes with its own set of complexities. In the following sections, I will delve into the specific challenges related to processing eddy covariance datasets and the intricacies of post-processing.

In particular, TWO observatories gather essential datasets related to water, energy and carbon cycles with an emphasis on collecting a broad range of environmental measurements such as radiation, temperature, precipitation, carbon fluxes, soil moisture and groundwater levels.
How eddy covariance works and why we need post-processing
Eddy covariance towers are based on the idea of measuring covariance which, as the name suggests, quantifies how two variables vary together, and in the context of “eddy” covariance measurements, it helps quantify the relationship between air movement and the concentration of atmospheric components such as water vapor.
Post-processing, on the other hand, is the essential step of refining collected raw data by filling gaps, removing errors and ensuring the dataset is accurate for further analysis. Thus, for eddy covariance data, post-processing is crucial as it enables scientists like the team I work with to accurately estimate energy and carbon exchanges between the land surface and atmosphere.
Another way you can think of these datasets is as a way of listening to the whispering of land to the atmosphere.
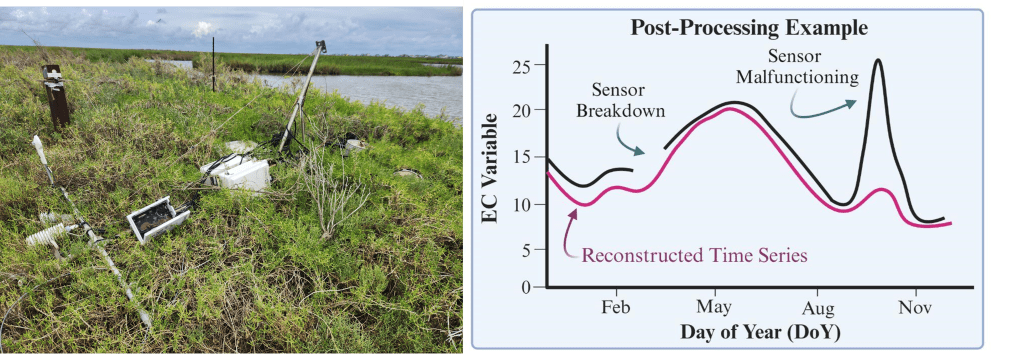
However, raw eddy covariance datasets are often riddled with challenges due to their exposure to the environment. One common issue is the presence of gaps in data due to sensor breakdowns or unfavorable meteorological conditions. Another problem is the occurrence of sudden, abnormal spikes in the data, typically indicating sensor malfunction.
Recently, I saw this firsthand when Hurricane Beryl hit near Houston, right by one of our TWO sites. The storm was so intense that it uprooted our entire EC tower along with several other sensors, leaving the site in complete disarray.
These interruptions make it difficult to achieve continuous and reliable data. Data gaps are especially problematic when studying critical ecosystem responses to extreme weather events or natural disasters. Researchers need consistent time series data to draw meaningful conclusions, but these interruptions create bottlenecks in the research process.
To address these challenges, specialized post-processing pipelines like Flux-data-qaqc and Reddyproc are used to standardize the correction and gap-filling process. These tools ensure data continuity by reconstructing missing segments and correcting anomalies, allowing researchers to maintain accurate and reliable datasets.

For instance, during the 2024 hurricane season, a sensor malfunction at a TWO site resulted in significant data loss that could have compromised the study of ecosystem resilience. However, post-processing tools were able to reconstruct the lost time series, providing invaluable insights that would have been otherwise unattainable.
Energy Balance Closure, Assumptions and Corrections
When managing data from solar energy measurements at the land surface, things can get tricky.
The solar energy reaching the surface is distributed among several key processes: net radiation (Rn), latent heat (LE), sensible heat (H) and ground heat flux (G).
Ideally, the energy entering and leaving the system should balance out, but in reality, the calculations often don’t match up. Interestingly, in most cases the closure achieved is only 60-70%! This discrepancy comes from the simplifying assumptions used to derive the energy balance equation, leading to an imbalance in the data collected from eddy covariance (EC) towers.
For data managers like me dealing with this issue, tools like the flux-data-qaqc package can be a game-changer. This package helps correct and adjust energy fluxes, particularly when it comes to generating accurate daily and monthly evapotranspiration (ET) estimates. It provides three different methods for energy balance closure corrections, the default being the Energy Balance Ratio (EBR) method. The EBR method works by filtering out extreme values that distort the data and then applying smoothing and gap-filling techniques to improve accuracy.
Using this package, we can adjust latent energy (LE) and sensible heat (H) data to produce corrected time series, ensuring a more accurate estimate of ET. This is done by applying correction factors derived from the EBR method and factoring in the influence of air temperature to fine-tune the calculations.
Tools like these not only streamline data management but also provide more reliable insights into energy fluxes, helping scientists and data managers overcome common challenges in raw datasets. For more details, explore the flux-data-qaqc GitHub page.
Carbon Fluxes, Ecosystem Respiration and Flux Partitioning
One of the main tasks of eddy covariance (EC) towers is to measure the Net Ecosystem Exchange (NEE) of carbon dioxide, which captures the balance between two key processes: photosynthesis, where plants absorb carbon dioxide, and ecosystem respiration, where carbon dioxide is released. Essentially, NEE reveals whether an ecosystem is absorbing more carbon than it releases (acting as a carbon sink) or releasing more than it absorbs (a carbon source).
However, it's not that straightforward — the same ecosystem may behave as carbon sink or carbon source depending on seasons! And believe me at your own risk or look at this paper: This is the main reason behind a lack of consensus and ongoing debates surrounding the effectiveness of forests for carbon sequestration.
Nevertheless, using some post-processing approximations, one can break NEE down further. There is Gross Primary Productivity (GPP), which stands in for photosynthesis, and Ecosystem Respiration (Reco), which tracks carbon release through respiration.
However, what approximations to use?
Largely, the EC community uses two main methods for estimating respiration in ecosystems. One approach, developed by Reichstein in 2005, estimates respiration using data collected at night and extends it to daytime periods. Another method, created by Lasslop in 2010, fits a Light-Response Curve (NEE ~ Radiation) to model how ecosystems respond to different levels of light and temperature. Both methods provide an estimate of how carbon flows in and out of an ecosystem, allowing us to quantify these exchanges more accurately.
Think of these carbon flux measurements like tracking the breathing of a forest. During the day, with plenty of light, photosynthesis drives carbon absorption — the forest breathing in. As the day cools or turns to night, respiration dominates, and carbon is released — the forest breathing out. Estimation of these components can be achieved through the Reddyproc package which helps clean raw EC data before partitioning of NEE to GPP and Reco to ensure accuracy.
For more details on these methods, you can explore additional information on their source page.
Temporal Inconsistencies and the Way Forward
Based on discussion so far, it might give an impression that the community has everything sorted out. However, while tools like flux-data-qaqc and Reddyproc have made significant strides in post-processing environmental flux datasets, they still present limitations, particularly in handling temporal resolution and a broader range of variables.
I have noticed that these packages can be quite sensitive to irregularities in raw datasets. For instance, if an energy balance component falls outside expected ranges, flux-data-qaqc often struggles to produce a corrected evapotranspiration estimate. From a data management standpoint, this presents a significant challenge, particularly with large datasets, as the same code doesn’t always apply effectively across different sites within TWO. I often find myself spending hours troubleshooting what might have gone wrong, only to end up making individual adjustments to my automation code—a task that’s far from enjoyable!
If it has gone unnoticed, let me remind you that flux-data-qaqc is a python package, while Reddyproc is an R package – so the user has to be proficient in both languages! More technically, Reddyproc excels at preserving high-resolution data, but flux-data-qaqc’s tendency to aggregate over longer time scales can lead to a loss of critical, short-term details. Additionally, both frameworks focus primarily on energy and carbon fluxes, leaving other key hydrological variables like soil moisture and groundwater largely unaddressed.
These challenges highlight a pressing issue for the environmental data management community: We need for more flexible and comprehensive post-processing tools that not only harmonize across temporal scales but also incorporate a wider array of measurements. Moving forward, addressing these gaps will be crucial for generating datasets that can better capture the complexity of ecosystem dynamics.
This is where I see the real opportunity for innovation. By refining our data management practices and expanding the scope of our post-processing tools, we can unlock deeper insights into environmental processes, leading to more robust and accurate research outcomes. Achieving this, however, calls for an open dialogue between data managers and scientists and greater recognition of the challenges data managers deal with in making the data research ready.
We want everything to be perfect, but in reality the best we can do is to patchwork our imperfections!
This blog was written by Debasish Mishra with edits from Allison Mills and Megan Orlando. The team used ChatGPT in drafts to help generate plain language text.
ESIP stands for Earth Science Information Partners and is a community of partner organizations and volunteers. We work together to meet environmental data challenges and look for opportunities to expand, improve, and innovate across Earth science disciplines.Learn more esipfed.org/get-involved and sign up for the weekly ESIP Update for #EarthScienceData events, funding, webinars and ESIP announcements.


