Innovation to Impact. See you at the July ESIP Meeting.
Climate Change and Community: New ESIP Lab Awards
Innovation and curiosity are core to the Earth Science Information Partners (ESIP) community. Each year, the ESIP Lab funds pilot projects to expand the impact of Earth science data. For the 2024 cohort, researchers focus on technology and computing to better understand and respond to challenges related to climate change and community resilience.
There are as many career paths in Earth science data as there are professionals in the field. People in ESIP come from a variety of backgrounds: Domain scientists pulling in computing and tech to do their research, data managers applying their skills to Earth science, technologists learning the ins and outs of metadata and team science.
As a space where so many disciplines mix, ESIP is a playground for learning and vetting new tech, software and tools. That is what the ESIP Lab grants are intended for.
“Our microfunding model normalizes experimentation and makes space to innovate and try out new ideas and approaches,” said Susan Shingledecker, ESIP Executive Director. “This year’s projects are especially timely. From flooding in Appalachia to heat waves in Miami, from aligning dataset formats to assessing classroom tools, the projects all have one common element — a clear impact on specific communities.”
The newly funded cohort of investigators all focus on technology needs for better understanding climate change and communities.
ESIP is proud to support four pilot projects through the ESIP Lab this year.
- Resilience and Innovation in Nature-based Stormwater Solutions (RAINSS)
- Community-led, Opensource, Opportunities to Learn (COOL): Community HeatMapper and Resilience Builder in Minority Communities in Miami, FL
- Leveraging Generative Artificial Intelligence (AI) for Automated Climate Resilience Dashboards: A Case Study on Flood Monitoring in Central Appalachia
- Open Science Cloud Tools and Educational Materials for the Integration of nClimGrid-Daily and Social Vulnerability Index Datasets
The ESIP Lab is a space for innovation in Earth science data, technology and computing.
The ESIP Lab provides microfunding to improve the collective tech savviness of Earth science research. Learning new skills — and testing new ideas — takes time, resources and deliberate effort. That’s why our grants process focuses on tying technical goals to learning objectives.
Learn more: esipfed.org/lab
Monitor rain gardens with students
Resilience and Innovation in Nature-based Stormwater Solutions (RAINSS)
Lauren Brase and Ed Robeck with American Geosciences Institute (AGI)
Stormwater runoff and floods affect many communities; asphalt, rooftops and other hard surfaces make this even more challenging in urban spaces. Nature-based solutions like rain gardens are popular, but knowing where to site them and measuring their effectiveness requires data.
Not all community stakeholders may be familiar with tools like the USGS Water Dashboard, USGS Land Cover Database, NOAA Climate Data Online and NRCS Web Soil Survey. And they may not know how to install or track key data points like rainfall and soil infiltration.
This gap presents an opportunity: To work with teachers and students in urban schools to build and monitor rain gardens as a way to learn about Earth science processes and data.
The American Geosciences Institute (AGI) team proposes three steps:
- Implement in Chicago and Atlanta classrooms by meeting with teachers for professional development and lesson planning so students can select sites by using infiltration tests, land surveys and soil texture analyses.
- Install stormwater mitigation strategies where students take the lead. Local soil and water conservation districts will review designs and help students build their rain gardens.
- Monitor the sites based around classroom curriculum and using Earth science tools like piezometers and soil moisture sensors.
Additionally, AGI has received matching funds for sustainability initiatives through American Association of Petroleum Geologists Foundation (AAPG-F), which doubles the impact of this project.


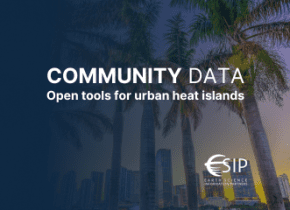
Make heat island tools for Miami neighborhoods
Community-led, Opensource, Opportunities to Learn (COOL): Community HeatMapper and Resilience Builder in Minority Communities in Miami, FL
Amy Quarkume, Keith Maull and Agbeli Ameko from Howard University
A lack of green spaces and cooling infrastructure can lead to urban “heat islands” where temps can rise up to 7 degrees hotter than surrounding areas. In the heart of Miami, Black and Latino heritage neighborhoods feel the heat.
The Howard team will work with the Miami Workers Center and Little Haiti residents to plan and pilot a smart Internet of Things (IoT) enabled, culturally responsive heat monitoring, alert system and technical infrastructure.
The work centers FAIR and CARE principles — Findable, Accessible, Interoperable and Reusable (FAIR) and Collective benefit, Authority to control, Responsibility and Ethics (CARE). Together, these principles can empower communities to collect and use data in ways that are open, actionable and respectful.
The project has four goals:
- Foster community-centric technical collaborations through co-designing and community engagement.
- Develop visualization-centered solutions focused on real-world data viz with sensor data using the openIoTwx platform.
- Facilitate interdisciplinary collaboration working with data scientists, historians, educational designers, journalists, sociologists, computer scientists and social scientists as well as civic partners and students.
- Communicate model and experience as communities of practice centered around community-led, open IoT sensornets using LoRaWAN gateways and nodes and MQ Telemetry Transport (MQTT) protocol.


–
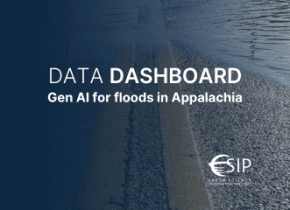
Use gen AI for floods in Appalachia
Leveraging Generative Artificial Intelligence (AI) for Automated Climate Resilience Dashboards: A Case Study on Flood Monitoring in Central Appalachia
Qian Huang from the Center for Rural Health and Research at East Tennessee State University and Tao Hu from Oklahoma State University
Just months ago, the ESIP community gathered in Asheville, North Carolina for the July ESIP Meeting. Following Hurricane Helene, the city and surrounding area flooded, with homes and businesses feet under water.
Unfortunately, flooding in Central Appalachia is predicted to continue.
As particularly vulnerable communities, sharing timely data and resources is important. Traditional dashboards create a bottleneck that relies on professional expertise and time-consuming human analysis. Generative Artificial Intelligence (AI) provides options for speeding up and automating processes to enhance decision making.
At the same time, community-engaged research has become increasingly impactful by focusing on local knowledge, cultural contexts and co-learning. It is research that is conducted “with” rather than “on” communities.
Huang and Hu propose a two-part approach to create flood dashboards for Appalachian communities:
- Leverage generative AI to enhance multi-source data collection, processing and integration pipelines to automate a dashboard interface.
- Conduct a Community Engagement Studio to ensure user-friendliness and replicability.
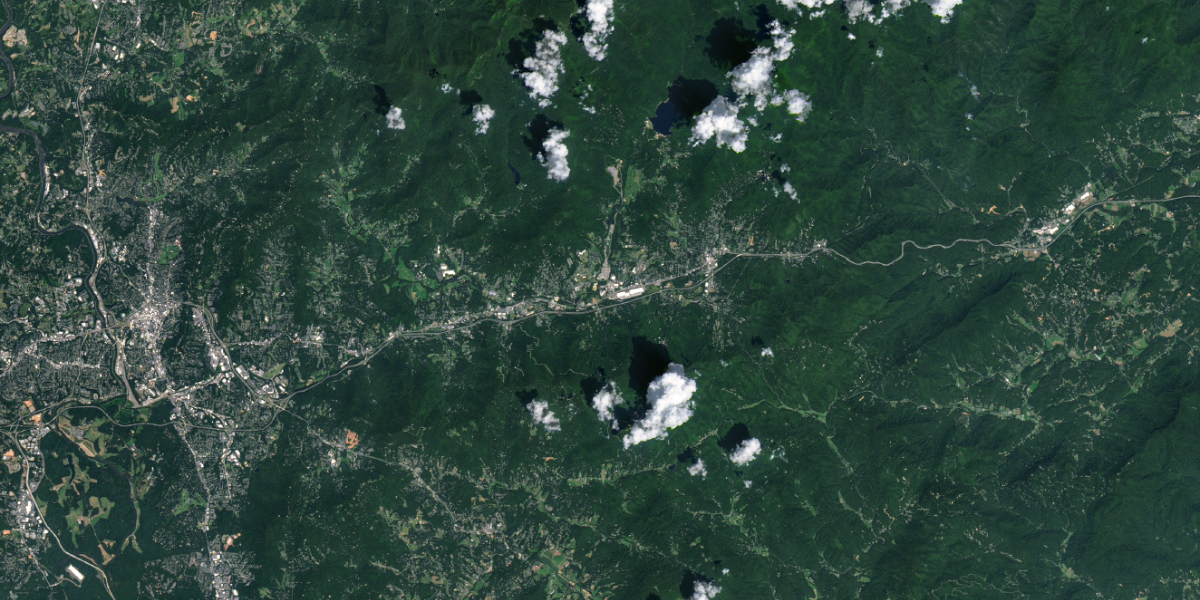
The MSI (MultiSpectral Instrument) on Sentinel-2 captured images of flooding on the French Broad and Swannanoa rivers near Asheville and Black Mountain (above right), and near Swannanoa (below) on October 2, 2024. The other image (above left), captured by the OLI (Operational Land Imager) on Landsat 8, shows the same area on August 30, 2024, when rivers were at more normal levels. The pair of images below is a detailed view of the town of Swannanoa before and after flooding. Credit: NASA
Get datasets to talk to each other
Open Science Cloud Tools and Educational Materials for the Integration of nClimGrid-Daily and Social Vulnerability Index Datasets
Joshua Brinks and Tom Parris from iSciences
Integrating climatic and population data is a first step in assessing the human impacts of climate extremes. However, most data is provided in monthly formats. That makes it difficult to understand extreme events that only last a few days.
There are daily gridded formats that make this analysis possible. The authoritative NOAA dataset is nClimGrid-Daily, which covers daily temperature and precipitation from 1951 through the present and is updated in near real time.
However, accessing and using nClimGrid-Daily is cumbersome even for experienced researchers and programmers.
The iSciences team wants to make daily gridded datasets more usable to better understand the impacts of climate on vulnerable populations. To pull in demographic data using NASA’s Social Vulnerability Index, the ISciences team proposes three steps:
- Open science tools for programmatic acquisition, analysis, and visualization of nClimGrid-daily along with integration and analysis of NASA’s Social Vulnerability Index.
- Open cloud hosting of pre-processed datasets integrated analysis in csv files. This is similar to the currently available nClimGrid-Daily zonal summaries, but with population and social vulnerability index weighted summaries.
- Shiny.io front end with some combination of dynamic visualizations, mapping, summary statistics and automated downloads for stakeholders and policy makers. This could look like interactive maps, figures, tables and direct downloads of csv files.
Want to know about the next ESIP Lab RFP?
Sign up for the weekly ESIP Update to hear about Lab updates, new projects, job and funding opportunities, and collaborations.
Allison Mills and Annie Burgess wrote this news release based on plain language summaries provided by the awarded teams. All of the award PIs reviewed their sections. The news release was provided ahead of posting to all the awardee’s organizations as well.
ESIP stands for Earth Science Information Partners and is a community of partner organizations and volunteers. We work together to meet environmental data challenges and look for opportunities to expand, improve, and innovate across Earth science disciplines.