Deadline Friday! Apply for the ESIP Raskin Scholarship by March 13. Learn more and apply.
Guest Blog: Introducing fluxtools – A New Tool for Visualizing and Exploring Flux Data
Kesondra Key is a 2025 Earth Science Information Partners (ESIP) Community Fellow. In her guest blog, she describes how she built a resource, fluxtools, to make working with eddy covariance data easier.
When I first started working with eddy covariance data, QA/QC felt overwhelming – so many plots, and I didn’t even know how to make half of them. Like many of us, I started cobbling together scripts to fill the gaps. One script became two, then a GitHub page, then automated plots and email reports… and eventually, a Shiny app: fluxtools. At first, it was just for me – a way to streamline QA/QC before submitting to AmeriFlux – but I realized other data managers and flux-data explorers might find it useful too.
What is eddy covariance, anyway?
An eddy covariance tower might look like a weather station, but it is built to do much more. Towers are packed with sensors measuring chemical and physical variables – CO₂, water vapor, temperature, radiation, soil moisture, humidity, heat, and others. For ecosystem scientists like me, their most important feature is their ability to quantify the exchange (flux) of carbon and water between the land and the atmosphere in near real time.
Image: Eddy covariance flux towers measure the ecosystem’s “breath,” – the CO2 and other gases that are exchanged between soil, vegetation and air. Credit: LI-COR Biosciences.
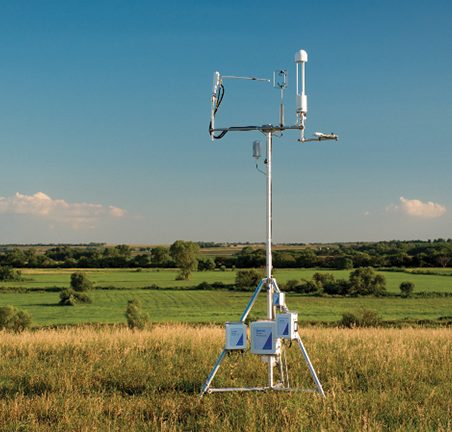
These instruments record at high frequency (typically 10 times per second), which is necessary to capture the rapid fluctuations in wind and gas concentrations used to calculate fluxes using the eddy covariance technique. In a nutshell, the towers are able to capture these chemical concentrations from small tumbling parcels of wind (called eddies), which allows us to use the covariance (how two variables change together) between vertical wind speed and CO₂ or water vapor concentrations to estimate how much carbon or water is moving into or out of the ecosystem. These high frequency data are then averaged into 30-minute intervals using programs like Loggernet and EddyPro.
But the QA/QC journey doesn’t end there.
Sensors get unplugged. Soil probes get pulled for maintenance. Birds poop on your IRGA or radiometer. Spikes appear that the physical world (on Earth) would never produce, like a 2000°F spike in Indiana.
So, we check for calibration issues, compare against nearby weather stations (or other flux towers), and make sure variables stay within physically meaningful limits.Only then can we finally think, Okay… maybe this dataset is ready for science.
FLUXNET: the gold standard
FLUXNET’s ONEFLUX pipeline is the gold standard for harmonizing flux datasets. It applies an extensive set of standardized checks, corrections, gap-filling steps, and flux-partitioning algorithms so data from hundreds of towers are directly comparable.
It’s thorough, it’s powerful, and it’s not trivial to run locally.
Fortunately, FLUXNET will process your dataset for free – but only after it has passed through AmeriFlux. That means your site needs to be registered, your data must meet required formatting and metadata standards, and all required variables need to be present before you’re placed into the ONEFLUX queue.
AmeriFlux: data repository and FLUXNET gatekeeper
AmeriFlux has its own QA/QC expectations and formatting rules. For example: timestamps cannot include daylight savings. If you forget to correct for that, your incoming shortwave radiation (SW_IN) vs. your incoming photosynthetic photon flux density (PPFD_IN) will sound the alarm pretty quickly.
AmeriFlux also checks for physical consistency. If your sonic temperature disagrees with the temperature paired with your RH sensor, or if impossible values show up, you’ll see them flagged in the QA/QC plots they send back.
When I first received these plots, I remember staring at a scatterplot that compared two variables, not including a timestamp, and wondering which mysterious single red dot was the culprit. Instead of manually hunting it down in the CSVs or static plots, I needed a way to interact with the data directly, so I built a Shiny app.
Enter: fluxtools – a Shiny-based R package for flux data QA/QC and exploration
fluxtools is a Shiny-interface R package designed for anyone working with AmeriFlux- or FLUXNET-formatted data, available through CRAN or GitHub. If your timestamps follow expected standards, you can load your dataset and instantly start exploring with interactive plots on the fly.
With fluxtools, you can explore individual variables or compare them while subsetting by year, month, or even time of day. The app allows you to directly select any wayward or suspicious points, and if you know they are due to sensor malfunction or maintenance, you can remove them directly in the app (i.e., convert them to NA).
You can also remove points that fall outside physically meaningful limits using the Physical Range Module (PRM), which automatically flags and removes values outside predefined ranges. These ranges are documented in the in-app help menu and are based on AmeriFlux Technical Notes – so you can always see exactly what’s being applied and why.
Transparency is important. The app includes an automated code-generation panel (for R – sorry, Python users!) that shows exactly how points were modified. You can copy this code into your own workflows, or export a cleaned dataset accompanied by an R script documenting every step performed in the app.
What fluxtools can do:
- Clickable point removal (QA/QC only!) – designed specifically for removing known sensor-related errors (e.g., unplugged sensors, maintenance periods, wildlife interference, instrument obstruction). This converts points to NA; it is not intended for trimming scientifically valid but “messy” environmental data. (Think: “remove the bird poop,” not “remove the inconvenient variance.”)
- Physical Range Module (PRM) – automatically clamp variables to physically reasonable bounds (based on AmeriFlux Technical Notes), with full audit tables and replay scripts.
- Reproducible outputs – export cleaned datasets and the exact R code used to generate them, making QA/QC steps transparent and repeatable.
- Multi-year support – load AmeriFlux/FLUXNET-style CSVs and explore multiple years at once.
- Flexible plotting – change x/y axes, subset by time, month, or year.
- Customizable aesthetics – adjust point/line size, add LOESS smoothing, and download plots directly.
- Outlier tools – compare variables or highlight/select outliers (e.g., ± standard deviations).
- Dataset comparison – overlay and compare two different sites (particularly useful for paired-site studies!).
Not doing QA/QC?
fluxtools is great for general data exploration and quick plotting – especially for those ‘presentation due tomorrow’ moments.
In short: fluxtools streamlines the AmeriFlux pre-submission workflow and makes flux data exploration significantly less painful. I originally built it to make my own life easier… but now it’s an R package others can use too.
Disclaimer: fluxtools is an independent project and is not affiliated with or endorsed by the AmeriFlux Network. “AmeriFlux” is a registered trademark of Lawrence Berkeley National Laboratory and is used here for identification purposes only.