Welcome to the new ESIP website!
Detecting tree species with Landsat imagery
How has the composition of forests in Vermont changed over the past 30 years, and how will it change in the next 30? Can we detect these changes using Landsat imagery? And if we can, what implications does this have for land cover change analyses worldwide?
UVM Research Assistant Professor and Forest Service Scientist Jennifer Pontius, UVM PhD student David Gudex-Cross, and I are using a novel technique to assign species-level classifications to the Northern Forest region using Landsat satellite imagery. Landsat imagery has 30m x 30m pixels, which means that any individual tree is undiscernible. In order to detect tree species we use a technique called “spectral unmixing.” The spectral unmixing approach trains an algorithm on the spectral signatures of pure pixels (i.e. pixels that are entirely or mostly composed of a single tree species) and then uses that information to “unmix” the spectral signatures of mixed pixels. This process can only be run on hyperspectral imagery, which would typically prevent us from using it to unmix the seven- to eleven-band images from Landsat. To address this, we’ve simulated hyperspectral imagery by stacking images from different seasons on top of each other to create images with approximately 50 bands, wherein each band contains unique information.
In addition to the unmixing process, David is applying an object-based image classification workflow to the images. This allows him to refine the classification based on ecological information such as climate, elevation, and soil type where a given tree species is known to occur or not to occur. The result is a map of tree species across the Northern Forest region based on freely-available satellite imagery. We are producing maps for seven 5-year time steps from 1985 to 2015.
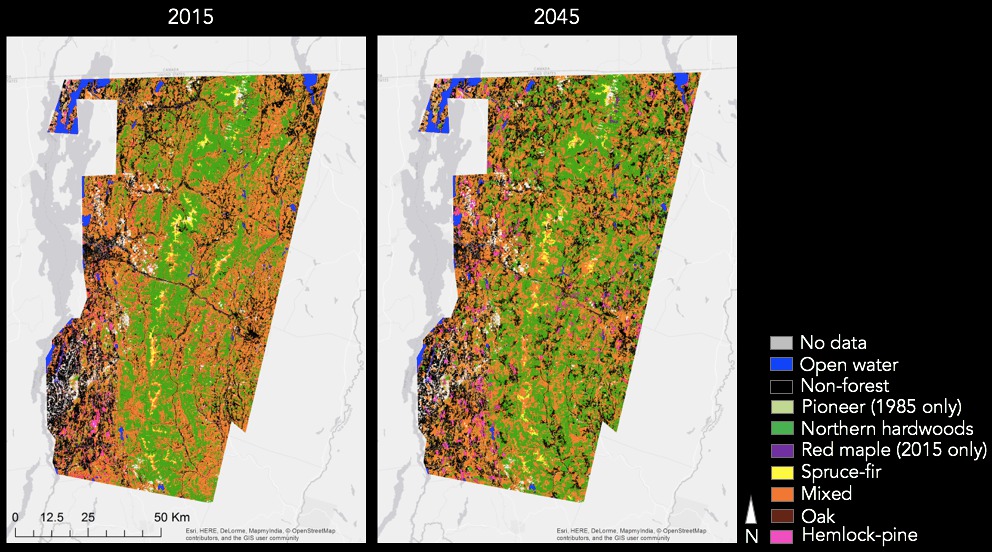
Jennifer Pontius, Research Assistant Professor Gillian Galford, and I are using these maps as inputs to a spatial model we’re building that simulates future trends in forest cover and composition based on past trends. The model calculates how many pixels transitioned from any one forest class to any other forest class (or to/from non-forest); correlates these transitions with other spatial variables such as population density, distance to roads, and average temperature; then uses these correlations and transition rates to simulate the future composition and extent of the Northern Forest. I recently ran a smaller version of this model on a portion of Vermont. The last observed (2015) and simulated (2045) landscapes are shown below.
Creative methods for analyzing free global imagery like that available from Landsat have enormous potential to catalyze similar analyses of changes in land cover worldwide. Currently most of these analyses are limited either to coarse land cover classifications such as those used by the National Land Cover Dataset, or to small geographic areas where more expensive imagery and/or field data can be obtained. If successful, this project could pave the way for broad-scale, fine-resolution analyses of compositional changes in other temperate forests worldwide.